Seismic Exploration- Notes/Graphs
Part 1:
You will be given a set of data taken by the KGS field team. They have conducted a seismic survey and processed the data to calculate the speed of sound in various layers of rock.
You will be given a set of data taken by the KGS field team. They have conducted a seismic survey and processed the data to calculate the speed of sound in various layers of rock.
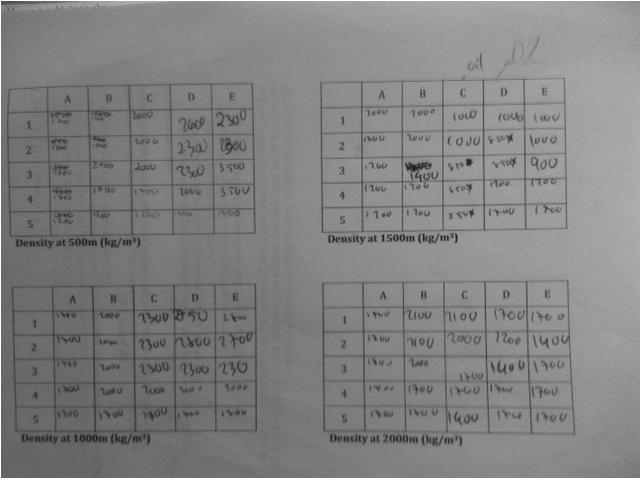
Your job: Calculate the density of the rock at each grid point.
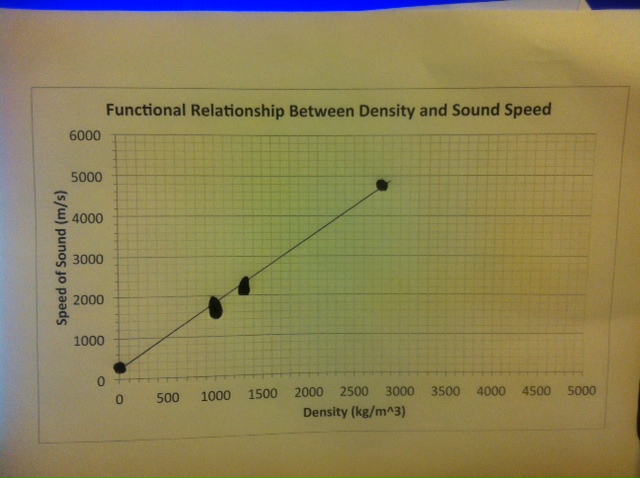
Speed of Sound (m/s) Density (kg/m3)
1500 850
1600 900
1700 1000
1800 1100
1900 1200
2000 1300
… ...
2500 1950
3000 1750
3500 1780
4000 2350
4500 2630
… ...
4600 2600
4700 2650
4800 2670
1500 850
1600 900
1700 1000
1800 1100
1900 1200
2000 1300
… ...
2500 1950
3000 1750
3500 1780
4000 2350
4500 2630
… ...
4600 2600
4700 2650
4800 2670
Part 2:
Now you are ready to convert the seismic raw data to a meaningful map, which might show where oil has formed and is trapped.
Now you are ready to convert the seismic raw data to a meaningful map, which might show where oil has formed and is trapped.
Part 3 :
With these cross sections of rock density, you now have enough information to make a proposal to BP about where to drill. Your project manager will write the final report to BP (likely a 100 page document containing detailed images of the proposed site, as well as information on optimal drilling angles, depths, speeds, type of rock and many other important details.)
With these cross sections of rock density, you now have enough information to make a proposal to BP about where to drill. Your project manager will write the final report to BP (likely a 100 page document containing detailed images of the proposed site, as well as information on optimal drilling angles, depths, speeds, type of rock and many other important details.)