GNOME Oil Spill Modeling Lab
Goals : After simulating an actual oil spill event, you will understand how oceanographers help to protect marine resources from pollution such as oil spills. You will use an actual modeling program, GNOME, to observe and predict oil spill trajectories. You will understand how weather and ocean conditions affect the fate of oil transport, and how modeling these conditions can help remediation effort.
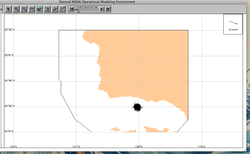
Materials: GNOME ( General NOAA Operational Modeling Environment) installed with a location file. In this case, we use the Santa Barbara file. Also required are a pencil, lab sheet and the " GNOME manual"
Part 1 :
1) Set up the spill in the model using the " GNOME manual" and the details of the spill and local weather conditions provided below.
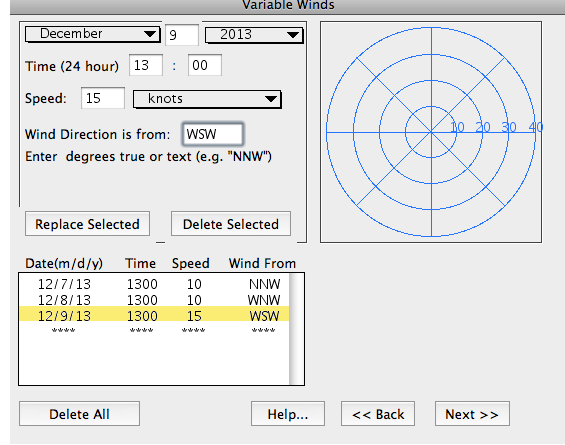
Wind: Variable
Day 1: NNW, 10 Knots ( auto- increment by 24 hours)
Day 2: WNW, 10 Knots
Day 3: WSW, 15 Knots
1) Set up the spill in the model using the " GNOME manual" and the details of the spill and local weather conditions provided below.
- Model Run Duration: 3 Days
- Weather conditions:
Wind: Variable
Day 1: NNW, 10 Knots ( auto- increment by 24 hours)
Day 2: WNW, 10 Knots
Day 3: WSW, 15 Knots
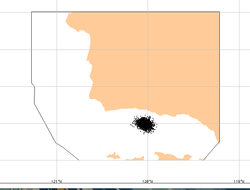
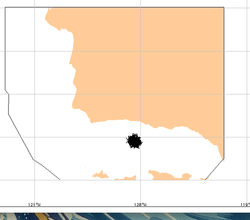
- Spill location : 34° 19' 54'' N and 119° 36' 47'' W
Day 1: NNW, 10 Knots ( auto- increment by 24 hours)
Santa Barbara oil spill from depending latitude 34 ° 19 '54'' N, flowing from the southeast to northwestward, the spill started on 12/06/2013 and finish in 12/09/2013 at the same hour in which started at 13:00. It going at 10 knots . Approach to land on the other side of Santa Barbara at 12/09/2013.
Santa Barbara oil spill from depending latitude 34 ° 19 '54'' N, flowing from the southeast to northwestward, the spill started on 12/06/2013 and finish in 12/09/2013 at the same hour in which started at 13:00. It going at 10 knots . Approach to land on the other side of Santa Barbara at 12/09/2013.
Day 2: WNW, 10 Knots
Day 3: WSW, 15 Knots
